
Organizations generate massive data volumes every day. IDC reports that global data creation reached 120 zettabytes in 2023. Industry estimates indicate that global data creation crossed 175 zettabytes by the end of 2025, driven by cloud, IoT, and digital platforms. However, IBM states that less than 1% of data gets analyzed. This gap limits decision quality. Poor data use also increases risk and cost.
Data visualization helps reduce this gap. It converts complex data into clear visuals. Gartner reports that visual analytics tools reduce decision time by up to 25%. McKinsey also notes that data-driven firms show 23% higher profitability.
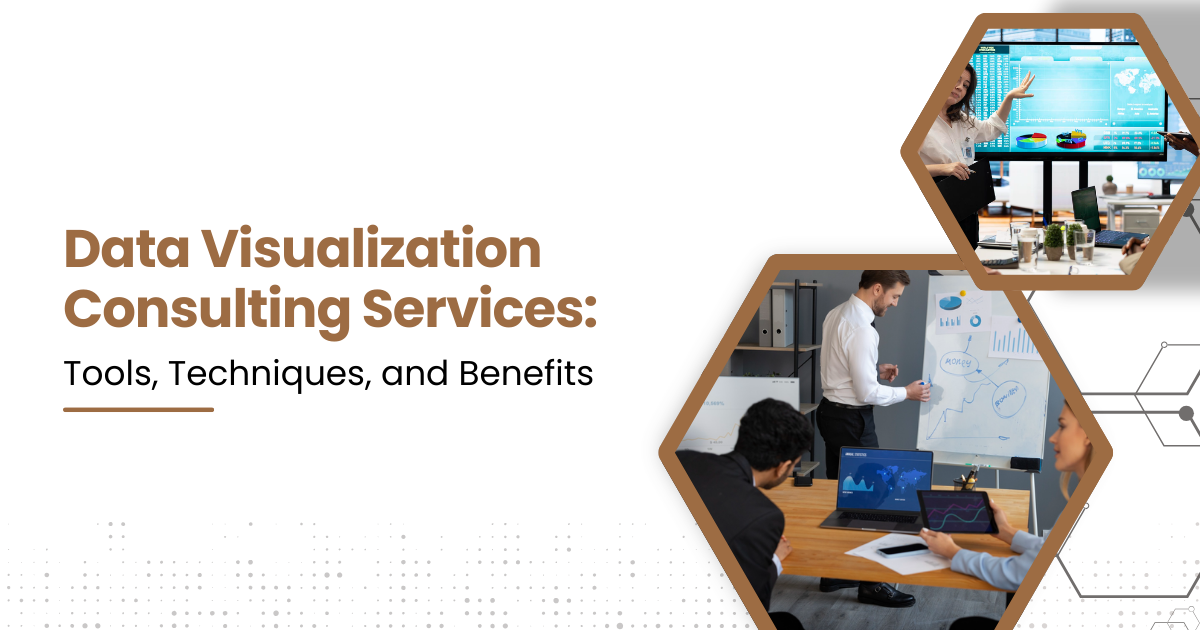
What Are Data Visualization Consulting Services
Data Visualization Consulting Services help firms design, build, and manage visual data systems. Consultants work with raw data, models, and dashboards. They ensure clarity, accuracy, and performance.
Core Scope
These services usually include:
- Data assessment and preparation: Consultants review data sources, formats, and quality. They clean, transform, and structure data for visual use.
- Tool selection and setup: Consultants evaluate business and technical needs. They select suitable BI or visualization tools.
- Dashboard and report design: Consultants design charts, layouts, and interactions. They align visuals with user roles and goals.
- Performance tuning: Consultants optimize data models and queries. They reduce load time and improve response speed.
- User training and support: Consultants train teams on tools and dashboards. They explain metrics, filters, and workflows.
- Governance and standards: Consultants define rules for metrics and naming. They set access, refresh, and version controls.
Consultants often work with data engineers, analysts, and leaders. Their goal is better insight and faster decisions.
Why Organizations Need Visualization Consultants
1. Growing Data Complexity
Modern systems collect data from many sources. These include IoT devices, APIs, logs, and databases. Data formats differ widely. Visualization consultants manage this complexity.
2. Skill Gaps
Many teams lack design and visual thinking skills. Engineers focus on logic, not layout. Consultants bridge this gap.
3. Performance and Scale Issues
Large datasets slow down dashboards. Poor queries cause delays. Consultants tune data models and visuals.
4. Compliance and Accuracy
Wrong charts mislead users. This causes poor decisions. Consultants enforce standards and validation rules.
Key Tools Used in Data Visualization Consulting Services
1. Business Intelligence Platforms
Consultants often use enterprise BI tools. Common options include:
- Tableau
- Microsoft Power BI
- Qlik Sense
- Looker
These tools support dashboards, filters, and real-time updates.
2. Open-Source Visualization Tools
For custom needs, consultants use open-source libraries:
- D3.js for web-based charts
- Plotly for interactive graphs
- Apache Superset for BI use cases.
These tools offer high flexibility.
3. Data Processing Tools
Visualization depends on clean data. Consultants rely on:
- SQL engines like PostgreSQL and MySQL
- Big data tools like Spark
- ETL tools such as Airflow
These ensure fast and correct data flow.
4. Cloud and Data Platforms
Many projects run on cloud systems:
- AWS Redshift
- Google BigQuery
- Azure Synapse
Consultants optimize visuals for cloud scale.
Technical Techniques Used by Visualization Consultants
1. Data Modeling for Visualization
Poor models break dashboards. Consultants design models for fast queries. They use star or snowflake schemas. They also reduce joins and duplicates.
2. Aggregation and Sampling
Large datasets often reduce chart responsiveness and user experience. Consultants apply aggregation techniques to summarize data at required levels. They use pre-aggregated tables and time-based rollups to limit real-time computation.
3. Visual Encoding Techniques
Effective visualization depends on correct visual encoding. Consultants select chart types based on data structure and purpose. Bar charts support comparison, while line charts show trends over time. Heatmaps represent data density, and scatter plots reveal relationships.
3. Interaction Design
Interactive elements improve data exploration and insight discovery. Consultants design filters and slicers to refine views quickly. Drill-down and drill-through options allow deeper analysis without clutter.
4. Performance Optimization
Dashboard performance directly affects user adoption. Consultants optimize indexes and tune queries to reduce execution time. Query caching and extract-based reporting also improve responsiveness.
Data Storytelling in Visualization Consulting
1. Purpose of Data Stories
Charts alone do not explain insight. Data stories guide users through meaning. Consultants build narratives with visuals.
2. Structure of a Data Story
A data story starts with a clear context and a defined goal. It then highlights key metrics that matter to the audience. Trends or patterns are used to explain changes over time or relationships.
3. Technical Balance
Consultants maintain technical accuracy in every data story. They present the full data range to avoid bias. They also document assumptions, filters, and limits. This approach ensures trust and correct interpretation.
Role of UX Principles in Data Visualization
1. Layout and Hierarchy
Consultants apply clear layout rules:
- Important metrics at the top
- Logical grouping of charts
- Consistent spacing
This reduces cognitive load.
2. Color and Contrast
Colors must support clarity. Consultants follow rules:
- Limited color palette
- High contrast for key values
- Colorblind-safe schemes
They avoid decoration-only colors.
3. Accessibility Standards
Good visuals serve all users. Consultants apply:
- Text labels instead of color only
- Keyboard navigation support
- Readable font sizes
This supports compliance needs.
Governance and Standards in Visualization Projects
Need for Governance
Without rules, dashboards grow chaotic. Metrics differ across teams. Consultants define standards.
Common Governance Areas
Governance often covers:
- Metric definitions
- Naming conventions
- Data refresh rules
- Access control
This ensures trust.
Version Control and Audits: Consultants use version control for reports. They also track changes. This helps with audits and rollbacks.
Industry Use Cases of Data Visualization Consulting Services
1. Financial Services
Banks use dashboards for risk and fraud. Consultants build real-time alert views. These track transactions and patterns.
2. Manufacturing
Factories monitor machines and output. Consultants design IoT dashboards. These show uptime, defects, and energy use.
3. Healthcare
Hospitals track patient flow and outcomes. Consultants ensure privacy and accuracy. Visuals support faster care decisions.
4. Retail and E-commerce
Retailers track sales and inventory. Consultants design demand and supply views. These reduce stock issues.
Benefits of Data Visualization Consulting Services
- Faster Decision Making: Clear visuals reduce analysis time. Gartner data shows a 25% faster decision cycle.
- Better Data Accuracy: Consultants validate sources and metrics. This reduces reporting errors.
- Higher User Adoption: Well-designed dashboards see higher use. Simple layouts improve trust.
- Cost and Resource Savings: Optimized queries reduce compute cost. Fewer reports reduce maintenance effort.
- Improved Strategic Planning: Executives gain clear views of trends. This supports long-term planning.
Technical Challenges Addressed by Consultants
1. Data Quality Issues
Missing, inconsistent, or incorrect data reduces trust in visuals. Consultants apply validation checks, cleansing rules, and transformation logic. They also monitor data refresh cycles to maintain accuracy over time.
2. Tool Limitations
Every visualization tool has functional and performance limits. Consultants understand these constraints early in the design phase. They adjust data models, visuals, or architecture to meet reporting needs without risk.
3. Scaling Dashboards
As user count and data volume increase, dashboards may slow down. Consultants design scalable data models and efficient queries. They also plan infrastructure to support concurrent access and future growth.
4. Integration Across Systems
Enterprise data often exists in isolated platforms. Consultants connect databases, APIs, and cloud services into a unified view. This integration ensures consistent reporting across all systems.
Also Read: The Psychology Behind Data Visualization: How Colors & Charts Affect Perception
Metrics Used to Measure Visualization Success
Consultants track clear metrics:
- Dashboard load time
- Query response time
- User adoption rate
- Error rate in reports
- Decision cycle duration
These metrics show real impact.
Choosing the Right Data Visualization Consulting Partner
Choosing the right data visualization consulting partner ensures long-term success. The right partner combines technical expertise with practical experience. They understand data architecture, visualization design, and business needs.
The following points explain key factors to consider during selection.
- Technical Skills: Look for strong data and BI skills. Tool certification matters.
- Industry Experience: Domain knowledge improves design quality.
- Process and Documentation: Good consultants document models and rules.
- Support and Training: Training ensures long-term success.
Future Trends in Data Visualization Consulting
1. Real-Time Analytics
More systems need live dashboards. Consultants design low-latency visuals.
2. Embedded Analytics
Dashboards move inside apps. Consultants build secure embeds.
3. AI-Assisted Insights
Some tools suggest patterns. Consultants validate these outputs.
4. Data Literacy Focus
Consultants now train users. This improves understanding and trust.
Conclusion
Data continues to grow at a rapid pace. Yet insight remains limited without clear visuals. Data Visualization Consulting Services address this gap. They combine tools, design, and engineering. They focus on accuracy, speed, and clarity.
From data modeling to dashboard delivery, consultants add value at every step. They reduce errors and improve decisions. They also ensure scalability and governance.
Organizations that invest in expert visualization gain a clear advantage. They turn data into reliable insight. They also support informed and timely actions.
In a data-driven world, visualization consulting is no longer optional. It is a technical and strategic necessity.